
Read more about animations in the previous issue of this series.
What we'll craft
This issue only scratches the surface of data visualization techniques that I'd like to explore further at some point. Since this territory is new to me—and perhaps to you as well—consider this article more of a training than a tutorial.
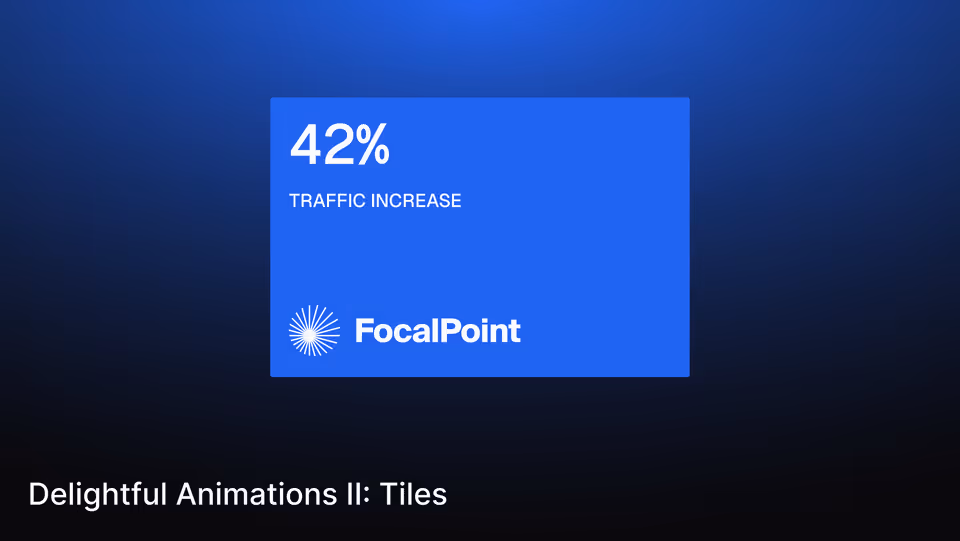
Today, we'll craft data tiles. They are small, contained units of information that highlight or contain key metrics or achievements in the presented context. They are a simple yet elegant element that fits nicely into decks and hero sections.
Forming the structure
The component's structure is straightforward, splitting into two parts. The top part contains the metric and its caption. The bottom part contains the logo or other interactive elements that offer additional information or allow users to take action.
<section class="tile grow relative flex flex-col">
  <div class="tile-top relative space-y-4 z-10 h-full font-medium tabular-nums p-4">
    <div class="tile-top-value text-5xl">{{ metric }}</div>
    <div class="uppercase">{{ caption }}</div>
  </div>
  <div class="tile-bottom absolute flex justify-end flex-col inset-0 mt-auto p-4">
    <img class="h-12 max-w-max" src="{{ logo }}" alt="" />
  </div>
</section>
Adding the animation
Last time, we implemented GSAP. This time, we'll explore a leaner, more refined favorite of mine: Anime.js. As always, make sure to install Anime.js first to ensure that everything works correctly within your environment.
npm install animejsimport { animate, utils, type EasingParam } from "animejs";After setting up, we will move on to the animation scaffolding. It consists of four elements that animate simultaneously, each addressing one of the previously established data tile elements, identifiable by CSS classes.
const tile = document.querySelector(".tile");
const tileTop = tile?.querySelector(".tile-top");
const tileTopValue = tile?.querySelector(".tile-top-value");
const tileBottom = tile?.querySelector(".tile-bottom");
To harmonize and later tweak the values across each animation, we will provide baseline values for duration and ease through constants. Using the types provided by the animejs package enables autocompletion for easing methods.
const duration: number = 1050;
const ease: EasingParam = "inOutQuart";
Tile
Now, we're getting to the animation itself. For the first animation, we'll focus on the entire tile. Using an opacity fade combined with a mask image transformation creates a nice bottom-to-top reveal effect, similar to a growing bar chart.
animate(tile, {
  duration,
  ease,
  opacity: [0, 1],
  maskImage: [
    "linear-gradient(transparent 100%, white 0%)",
    "linear-gradient(transparent 0%, white 0%)",
  ],
});
Top & Value
For the second animation, we will animate both the top part and the value contained within. The top part translates along the Y-axis from bottom to top. Meanwhile, the value within updates its textContent based on the modifier.
animate(tileTop, {
  duration,
  ease,
  translateY: ["100%", 0],
  onBegin: () => {
    animate(tileTopValue, {
      duration,
      ease,
      modifier: utils.round(0),
      textContent: [0, tileTopValue.textContent],
    });
  },
});
Bottom
At last, we animate the bottom part, which uses a delayed opacity fade to avoid conflicting with the contents of the rising top part. I chose to keep the bottom part in a static position to establish an origin point for translation along the Y-axis.
animate(tileBottom, {
  duration: duration * 0.75,
  delay: duration / 4,
  ease,
  opacity: [0, 1],
});
And just like that (again), we've implemented another simple yet beautiful animation. Going forward, it would be relatively trivial to turn our new structure into a reusable component for applications and presentations.
TL;DR
This article provides practical code for animating data tiles, making hero sections and presentations more dynamic, by combining simple HTML structures with the amazing Anime.js animation library.